Access Parquet files#
import pandas as pd
parquet_path = "files/shots.parquet"
signal_path = "files/signals.parquet"
source_path = "files/sources.parquet"
Shot database#
shots_df = pd.read_parquet(parquet_path)
shots_df.head()
| shot_id | divertor_config | heating | current_range | plasma_shape | pellets | rmp_coil | preshot_description | postshot_description | comissioner | reference_id | scenario | timestamp | campaign | reference_shot | scenario_id | |
|---|---|---|---|---|---|---|---|---|---|---|---|---|---|---|---|---|
| 0 | 11695 | Conventional | None | None | None | 0.0 | NaN | \n0.1T TF SHOT\n | \nOK\n | None | <NA> | None | 2004-12-13 11:54:00 | M5 | <NA> | NaN |
| 1 | 11696 | Conventional | None | None | None | 0.0 | NaN | \nSTANDARD 0.3T TF SHOT\n | \nOK\n | None | <NA> | None | 2004-12-13 12:07:00 | M5 | <NA> | NaN |
| 2 | 11697 | Conventional | None | None | None | 0.0 | NaN | \nRAISE TO 0.5T\n | \nOK, ALARMS ARE LOWER\n | None | <NA> | None | 2004-12-13 12:19:00 | M5 | <NA> | NaN |
| 3 | 11698 | Conventional | None | None | None | 0.0 | NaN | \nRAISE TO .56T\n | \nSTILL ALARMS BUT LOWER AGAIN\n | None | <NA> | None | 2004-12-13 12:31:00 | M5 | <NA> | NaN |
| 4 | 11699 | Conventional | None | None | None | 0.0 | NaN | \nRAISE TO .58T\n | \nOK\n | None | <NA> | None | 2004-12-13 12:45:00 | M5 | <NA> | NaN |
list(shots_df.columns)
['shot_id',
 'divertor_config',
 'heating',
 'current_range',
 'plasma_shape',
 'pellets',
 'rmp_coil',
 'preshot_description',
 'postshot_description',
 'comissioner',
 'reference_id',
 'scenario',
 'timestamp',
 'campaign',
 'reference_shot',
 'scenario_id']
Source database#
sources_df = pd.read_parquet(source_path)
sources_df.head()
| uda_name | uuid | shot_id | name | description | version | quality | signal_type | mds_name | format | source | file_name | dimensions | shape | rank | |
|---|---|---|---|---|---|---|---|---|---|---|---|---|---|---|---|
| 0 | ABM | 611facf2-a89f-5487-b61a-cef8db3d916c | 30110 | abm | multi-chord bolometers | 0 | Not Checked | Analysed | None | IDA3 | abm | abm0301.10 | None | None | NaN |
| 1 | ADA | eb668e89-0f20-5b06-962e-eabf47fb10c3 | 30110 | ada | Linear D-Alpha Camera | 0 | Not Checked | Analysed | None | IDA3 | ada | ada0301.10 | None | None | NaN |
| 2 | ADG | a808e5b6-509f-5589-857a-9659651d6ba9 | 30110 | adg | Plasma Edge Density gradient from the linear D... | 0 | Not Checked | Analysed | None | IDA3 | adg | adg0301.10 | None | None | NaN |
| 3 | AGA | 43386da5-27ee-5290-9822-a97ef6b00c01 | 30110 | aga | molecular deuterium pressure, neutral gas pres... | 0 | Not Checked | Analysed | None | IDA3 | aga | aga0301.10 | None | None | NaN |
| 4 | AMC | b76e6bc3-3782-5157-8930-b1bb1e3d4db3 | 30110 | amc | Plasma Current and PF/TF Coil Currents | 0 | Not Checked | Analysed | None | IDA3 | amc | amc0301.10 | None | None | NaN |
list(sources_df.columns)
['uda_name',
 'uuid',
 'shot_id',
 'name',
 'description',
 'version',
 'quality',
 'signal_type',
 'mds_name',
 'format',
 'source',
 'file_name',
 'dimensions',
 'shape',
 'rank']
Signal database#
signals_df = pd.read_parquet(signal_path)
signals_df.head()
| uda_name | uuid | shot_id | name | description | version | quality | signal_type | mds_name | format | source | file_name | dimensions | shape | rank | |
|---|---|---|---|---|---|---|---|---|---|---|---|---|---|---|---|
| 0 | ABM_CALIB_SHOT | 34730df5-a24d-509c-9e13-f222729b7bbb | 30110 | abm/calib_shot | None | 0 | Not Checked | Analysed | \TOP.ANALYSED.ABM:CALIB_SHOT | None | abm | None | [] | [] | 0 |
| 1 | ABM_CHANNEL_STATUS | 7af10d96-f332-5c1c-b8bf-bfdabd76e9e9 | 30110 | abm/channel_status | None | 0 | Not Checked | Analysed | \TOP.ANALYSED.ABM.CHANNEL:STATUS | None | abm | None | [dim_0] | [32] | 1 |
| 2 | ABM_CHANNEL_TYPE | f479cee3-51ae-53ff-a58a-cf3ead29ef87 | 30110 | abm/channel_type | None | 0 | Not Checked | Analysed | \TOP.ANALYSED.ABM:CHANNEL_TYPE | None | abm | None | [dim_0] | [32] | 1 |
| 3 | ABM | 611facf2-a89f-5487-b61a-cef8db3d916c | 30110 | abm | None | 0 | Not Checked | Analysed | None | IDA3 | abm | abm0301.10 | [chord] | [11] | 1 |
| 4 | ABM | 611facf2-a89f-5487-b61a-cef8db3d916c | 30110 | abm | None | 0 | Not Checked | Analysed | None | IDA3 | abm | abm0301.10 | [dim_0] | [32] | 1 |
list(signals_df.columns)
['uda_name',
 'uuid',
 'shot_id',
 'name',
 'description',
 'version',
 'quality',
 'signal_type',
 'mds_name',
 'format',
 'source',
 'file_name',
 'dimensions',
 'shape',
 'rank']
Exploring one shot#
import zarr
import s3fs
import matplotlib.pyplot as plt
import xarray as xr
import dask
import numpy as np
shot_number = 30420
# Set up the S3 storage options

endpoint = "https://s3.echo.stfc.ac.uk"
fs = s3fs.S3FileSystem(endpoint_url=endpoint, anon=True)

filename = "s3://mast/level1/shots/"+ str(shot_number) + ".zarr"
print(filename +"/amc")
amc = xr.open_zarr(fs.get_mapper(filename +"/amc"))
s3://mast/level1/shots/30420.zarr/amc
amc
<xarray.Dataset> Size: 5MB
Dimensions:            (time: 30000)
Coordinates:
  * time               (time) float32 120kB -2.0 -2.0 -2.0 ... 3.999 4.0 4.0
Data variables: (12/46)
    efps_current       (time) float32 120kB dask.array<chunksize=(30000,), meta=np.ndarray>
    error_field_02     (time) float32 120kB dask.array<chunksize=(30000,), meta=np.ndarray>
    error_field_05     (time) float32 120kB dask.array<chunksize=(30000,), meta=np.ndarray>
    p2il_coil_current  (time) float32 120kB dask.array<chunksize=(30000,), meta=np.ndarray>
    p2il_feed_current  (time) float32 120kB dask.array<chunksize=(30000,), meta=np.ndarray>
    p2iu_coil_current  (time) float32 120kB dask.array<chunksize=(30000,), meta=np.ndarray>
    ...                 ...
    p6u_current        (time) float32 120kB dask.array<chunksize=(30000,), meta=np.ndarray>
    plasma_current     (time) float32 120kB dask.array<chunksize=(30000,), meta=np.ndarray>
    sol_current        (time) float32 120kB dask.array<chunksize=(30000,), meta=np.ndarray>
    status             float32 4B ...
    tf_current         (time) float32 120kB dask.array<chunksize=(30000,), meta=np.ndarray>
    version            float32 4B ...
Attributes:
    description:  Plasma Current and PF/TF Coil Currents
    file_name:    amc0304.20
    format:       IDA3
    mds_name:     None
    name:         amc
    quality:      Not Checked
    shot_id:      30420
    signal_type:  Analysed
    source:       amc
    uda_name:     AMC
    uuid:         01aad0c4-2a84-59e2-8b1b-168b4bd66aa3
    version:      0
xarray.Dataset
- time: 30000
- time(time)float32-2.0 -2.0 -2.0 ... 3.999 4.0 4.0
- units :
- s
array([-2.      , -1.9998  , -1.9996  , ...,  3.999399,  3.9996  ,  3.999799],
      dtype=float32)
- efps_current(time)float32dask.array<chunksize=(30000,), meta=np.ndarray>
- description :
- EFPS current measured at input to P2 link board
- dims :
- ['time']
- file_name :
- None
- format :
- None
- label :
- EFPS Current
- mds_name :
- \TOP.ANALYSED.AMC:EFPS_CURRENT
- name :
- amc/efps_current
- quality :
- Not Checked
- rank :
- 1
- shape :
- [30000]
- shot_id :
- 30420
- signal_type :
- Analysed
- source :
- amc
- time_index :
- 0
- uda_name :
- AMC_EFPS CURRENT
- units :
- kA
- uuid :
- 184cb059-3b20-5ff2-87fb-959ce07c42d0
- version :
- 0
Array Chunk Bytes 117.19 kiB 117.19 kiB Shape (30000,) (30000,) Dask graph 1 chunks in 2 graph layers Data type float32 numpy.ndarray - error_field_02(time)float32dask.array<chunksize=(30000,), meta=np.ndarray>
- description :
- dims :
- ['time']
- file_name :
- None
- format :
- None
- label :
- Error Field/02
- mds_name :
- \TOP.ANALYSED.AMC.ERROR_FIELD:02
- name :
- amc/error_field_02
- quality :
- Not Checked
- rank :
- 1
- shape :
- [30000]
- shot_id :
- 30420
- signal_type :
- Analysed
- source :
- amc
- time_index :
- 0
- uda_name :
- AMC_ERROR FIELD/02
- units :
- kA * turn
- uuid :
- a48b22d3-dc5b-57cc-805b-e2875e4b4783
- version :
- 0
Array Chunk Bytes 117.19 kiB 117.19 kiB Shape (30000,) (30000,) Dask graph 1 chunks in 2 graph layers Data type float32 numpy.ndarray - error_field_05(time)float32dask.array<chunksize=(30000,), meta=np.ndarray>
- description :
- dims :
- ['time']
- file_name :
- None
- format :
- None
- label :
- Error Field/05
- mds_name :
- \TOP.ANALYSED.AMC.ERROR_FIELD:05
- name :
- amc/error_field_05
- quality :
- Not Checked
- rank :
- 1
- shape :
- [30000]
- shot_id :
- 30420
- signal_type :
- Analysed
- source :
- amc
- time_index :
- 0
- uda_name :
- AMC_ERROR FIELD/05
- units :
- kA * turn
- uuid :
- a2a22abc-b6dd-5115-87b9-a3106ff30110
- version :
- 0
Array Chunk Bytes 117.19 kiB 117.19 kiB Shape (30000,) (30000,) Dask graph 1 chunks in 2 graph layers Data type float32 numpy.ndarray - p2il_coil_current(time)float32dask.array<chunksize=(30000,), meta=np.ndarray>
- description :
- P2 inner lower current (pseudo coil current signal used by EFIT)
- dims :
- ['time']
- file_name :
- None
- format :
- None
- label :
- P2IL Coil Current
- mds_name :
- \TOP.ANALYSED.AMC.P2IL_COIL:CURRENT
- name :
- amc/p2il_coil_current
- quality :
- Not Checked
- rank :
- 1
- shape :
- [30000]
- shot_id :
- 30420
- signal_type :
- Analysed
- source :
- amc
- time_index :
- 0
- uda_name :
- AMC_P2IL COIL CURRENT
- units :
- kA * turn
- uuid :
- 63691830-c58d-5f03-a811-5601bca0e0b9
- version :
- 0
Array Chunk Bytes 117.19 kiB 117.19 kiB Shape (30000,) (30000,) Dask graph 1 chunks in 2 graph layers Data type float32 numpy.ndarray - p2il_feed_current(time)float32dask.array<chunksize=(30000,), meta=np.ndarray>
- description :
- P2L inner winding current - measured at P2 link board
- dims :
- ['time']
- file_name :
- None
- format :
- None
- label :
- P2il Feed Current
- mds_name :
- \TOP.ANALYSED.AMC.P2IL_FEED:CURRENT
- name :
- amc/p2il_feed_current
- quality :
- Not Checked
- rank :
- 1
- shape :
- [30000]
- shot_id :
- 30420
- signal_type :
- Analysed
- source :
- amc
- time_index :
- 0
- uda_name :
- AMC_P2IL FEED CURRENT
- units :
- kA
- uuid :
- af5c935e-ce9a-5b8f-b7be-2e97726f314a
- version :
- 0
Array Chunk Bytes 117.19 kiB 117.19 kiB Shape (30000,) (30000,) Dask graph 1 chunks in 2 graph layers Data type float32 numpy.ndarray - p2iu_coil_current(time)float32dask.array<chunksize=(30000,), meta=np.ndarray>
- description :
- P2 inner upper feed current (pseudo coil current signal used by EFIT)
- dims :
- ['time']
- file_name :
- None
- format :
- None
- label :
- P2IU Coil Current
- mds_name :
- \TOP.ANALYSED.AMC.P2IU_COIL:CURRENT
- name :
- amc/p2iu_coil_current
- quality :
- Not Checked
- rank :
- 1
- shape :
- [30000]
- shot_id :
- 30420
- signal_type :
- Analysed
- source :
- amc
- time_index :
- 0
- uda_name :
- AMC_P2IU COIL CURRENT
- units :
- kA * turn
- uuid :
- 26141f74-c0b6-5718-b28f-b40765ca326e
- version :
- 0
Array Chunk Bytes 117.19 kiB 117.19 kiB Shape (30000,) (30000,) Dask graph 1 chunks in 2 graph layers Data type float32 numpy.ndarray - p2iu_feed_current(time)float32dask.array<chunksize=(30000,), meta=np.ndarray>
- description :
- P2U inner winding current - measured at P2 link board
- dims :
- ['time']
- file_name :
- None
- format :
- None
- label :
- P2iu Feed Current
- mds_name :
- \TOP.ANALYSED.AMC.P2IU_FEED:CURRENT
- name :
- amc/p2iu_feed_current
- quality :
- Not Checked
- rank :
- 1
- shape :
- [30000]
- shot_id :
- 30420
- signal_type :
- Analysed
- source :
- amc
- time_index :
- 0
- uda_name :
- AMC_P2IU FEED CURRENT
- units :
- kA
- uuid :
- 6f129101-1a1b-5d41-afa3-01b38587dafb
- version :
- 0
Array Chunk Bytes 117.19 kiB 117.19 kiB Shape (30000,) (30000,) Dask graph 1 chunks in 2 graph layers Data type float32 numpy.ndarray - p2l_case_current(time)float32dask.array<chunksize=(30000,), meta=np.ndarray>
- description :
- P2 lower case current (pseudo coil current signal used by EFIT)
- dims :
- ['time']
- file_name :
- None
- format :
- None
- label :
- P2L Case Current
- mds_name :
- \TOP.ANALYSED.AMC.P2L_CASE:CURRENT
- name :
- amc/p2l_case_current
- quality :
- Not Checked
- rank :
- 1
- shape :
- [30000]
- shot_id :
- 30420
- signal_type :
- Analysed
- source :
- amc
- time_index :
- 0
- uda_name :
- AMC_P2L CASE CURRENT
- units :
- kA
- uuid :
- 99aad5b5-f691-53fb-9b50-cfca47478c1e
- version :
- 0
Array Chunk Bytes 117.19 kiB 117.19 kiB Shape (30000,) (30000,) Dask graph 1 chunks in 2 graph layers Data type float32 numpy.ndarray - p2l_current(time)float32dask.array<chunksize=(30000,), meta=np.ndarray>
- description :
- Internal P2L current
- dims :
- ['time']
- file_name :
- None
- format :
- None
- label :
- P2L Current
- mds_name :
- \TOP.ANALYSED.AMC:P2L_CURRENT
- name :
- amc/p2l_current
- quality :
- Not Checked
- rank :
- 1
- shape :
- [30000]
- shot_id :
- 30420
- signal_type :
- Analysed
- source :
- amc
- time_index :
- 0
- uda_name :
- AMC_P2L CURRENT
- units :
- kA * turn
- uuid :
- 48b41de3-eac6-54a2-896c-c5a3e78c176d
- version :
- 0
Array Chunk Bytes 117.19 kiB 117.19 kiB Shape (30000,) (30000,) Dask graph 1 chunks in 2 graph layers Data type float32 numpy.ndarray - p2ol_coil_current(time)float32dask.array<chunksize=(30000,), meta=np.ndarray>
- description :
- P2 outer lower current (pseudo coil current signal used by EFIT)
- dims :
- ['time']
- file_name :
- None
- format :
- None
- label :
- P2OL Coil Current
- mds_name :
- \TOP.ANALYSED.AMC.P2OL_COIL:CURRENT
- name :
- amc/p2ol_coil_current
- quality :
- Not Checked
- rank :
- 1
- shape :
- [30000]
- shot_id :
- 30420
- signal_type :
- Analysed
- source :
- amc
- time_index :
- 0
- uda_name :
- AMC_P2OL COIL CURRENT
- units :
- kA * turn
- uuid :
- 22c92239-552f-5da4-aed1-4595f9998392
- version :
- 0
Array Chunk Bytes 117.19 kiB 117.19 kiB Shape (30000,) (30000,) Dask graph 1 chunks in 2 graph layers Data type float32 numpy.ndarray - p2ol_feed_current(time)float32dask.array<chunksize=(30000,), meta=np.ndarray>
- description :
- P2L outer winding current - measured at P2 link board
- dims :
- ['time']
- file_name :
- None
- format :
- None
- label :
- P2ol Feed Current
- mds_name :
- \TOP.ANALYSED.AMC.P2OL_FEED:CURRENT
- name :
- amc/p2ol_feed_current
- quality :
- Not Checked
- rank :
- 1
- shape :
- [30000]
- shot_id :
- 30420
- signal_type :
- Analysed
- source :
- amc
- time_index :
- 0
- uda_name :
- AMC_P2OL FEED CURRENT
- units :
- kA
- uuid :
- c8485623-2746-5b7c-9a53-b0f085ff54f9
- version :
- 0
Array Chunk Bytes 117.19 kiB 117.19 kiB Shape (30000,) (30000,) Dask graph 1 chunks in 2 graph layers Data type float32 numpy.ndarray - p2ou_coil_current(time)float32dask.array<chunksize=(30000,), meta=np.ndarray>
- description :
- P2 outer upper feed current (pseudo coil current signal used by EFIT)
- dims :
- ['time']
- file_name :
- None
- format :
- None
- label :
- P2OU Coil Current
- mds_name :
- \TOP.ANALYSED.AMC.P2OU_COIL:CURRENT
- name :
- amc/p2ou_coil_current
- quality :
- Not Checked
- rank :
- 1
- shape :
- [30000]
- shot_id :
- 30420
- signal_type :
- Analysed
- source :
- amc
- time_index :
- 0
- uda_name :
- AMC_P2OU COIL CURRENT
- units :
- kA * turn
- uuid :
- f4963f6c-a084-574a-ad4e-58ab7c977b29
- version :
- 0
Array Chunk Bytes 117.19 kiB 117.19 kiB Shape (30000,) (30000,) Dask graph 1 chunks in 2 graph layers Data type float32 numpy.ndarray - p2ou_feed_current(time)float32dask.array<chunksize=(30000,), meta=np.ndarray>
- description :
- P2U outer winding current - measured at P2 link board
- dims :
- ['time']
- file_name :
- None
- format :
- None
- label :
- P2ou Feed Current
- mds_name :
- \TOP.ANALYSED.AMC.P2OU_FEED:CURRENT
- name :
- amc/p2ou_feed_current
- quality :
- Not Checked
- rank :
- 1
- shape :
- [30000]
- shot_id :
- 30420
- signal_type :
- Analysed
- source :
- amc
- time_index :
- 0
- uda_name :
- AMC_P2OU FEED CURRENT
- units :
- kA
- uuid :
- 14f2d15f-7449-5d82-9269-3543d772d2b3
- version :
- 0
Array Chunk Bytes 117.19 kiB 117.19 kiB Shape (30000,) (30000,) Dask graph 1 chunks in 2 graph layers Data type float32 numpy.ndarray - p2u_case_current(time)float32dask.array<chunksize=(30000,), meta=np.ndarray>
- description :
- P2 upper case current (pseudo coil current signal used by EFIT)
- dims :
- ['time']
- file_name :
- None
- format :
- None
- label :
- P2U Case Current
- mds_name :
- \TOP.ANALYSED.AMC.P2U_CASE:CURRENT
- name :
- amc/p2u_case_current
- quality :
- Not Checked
- rank :
- 1
- shape :
- [30000]
- shot_id :
- 30420
- signal_type :
- Analysed
- source :
- amc
- time_index :
- 0
- uda_name :
- AMC_P2U CASE CURRENT
- units :
- kA
- uuid :
- dc9cf0aa-73df-5b8a-ae76-28784eda0ffd
- version :
- 0
Array Chunk Bytes 117.19 kiB 117.19 kiB Shape (30000,) (30000,) Dask graph 1 chunks in 2 graph layers Data type float32 numpy.ndarray - p2u_current(time)float32dask.array<chunksize=(30000,), meta=np.ndarray>
- description :
- Internal P2U current
- dims :
- ['time']
- file_name :
- None
- format :
- None
- label :
- P2U Current
- mds_name :
- \TOP.ANALYSED.AMC:P2U_CURRENT
- name :
- amc/p2u_current
- quality :
- Not Checked
- rank :
- 1
- shape :
- [30000]
- shot_id :
- 30420
- signal_type :
- Analysed
- source :
- amc
- time_index :
- 0
- uda_name :
- AMC_P2U CURRENT
- units :
- kA * turn
- uuid :
- 1f335921-0caa-5a97-9c20-66979363b26f
- version :
- 0
Array Chunk Bytes 117.19 kiB 117.19 kiB Shape (30000,) (30000,) Dask graph 1 chunks in 2 graph layers Data type float32 numpy.ndarray - p3l_case_current(time)float32dask.array<chunksize=(30000,), meta=np.ndarray>
- description :
- dims :
- ['time']
- file_name :
- None
- format :
- None
- label :
- P3L Case Current
- mds_name :
- \TOP.ANALYSED.AMC.P3L_CASE:CURRENT
- name :
- amc/p3l_case_current
- quality :
- Not Checked
- rank :
- 1
- shape :
- [30000]
- shot_id :
- 30420
- signal_type :
- Analysed
- source :
- amc
- time_index :
- 0
- uda_name :
- AMC_P3L CASE CURRENT
- units :
- kA
- uuid :
- 23c0924c-2ee4-5cc6-8e2d-03ac857efeef
- version :
- 0
Array Chunk Bytes 117.19 kiB 117.19 kiB Shape (30000,) (30000,) Dask graph 1 chunks in 2 graph layers Data type float32 numpy.ndarray - p3l_coil_current(time)float32dask.array<chunksize=(30000,), meta=np.ndarray>
- description :
- dims :
- ['time']
- file_name :
- None
- format :
- None
- label :
- P3L Coil Current
- mds_name :
- \TOP.ANALYSED.AMC.P3L_COIL:CURRENT
- name :
- amc/p3l_coil_current
- quality :
- Not Checked
- rank :
- 1
- shape :
- [30000]
- shot_id :
- 30420
- signal_type :
- Analysed
- source :
- amc
- time_index :
- 0
- uda_name :
- AMC_P3L COIL CURRENT
- units :
- kA * turn
- uuid :
- d5f3c8aa-7335-5260-92cd-0392ea4bc035
- version :
- 0
Array Chunk Bytes 117.19 kiB 117.19 kiB Shape (30000,) (30000,) Dask graph 1 chunks in 2 graph layers Data type float32 numpy.ndarray - p3l_current(time)float32dask.array<chunksize=(30000,), meta=np.ndarray>
- description :
- Internal P3L current
- dims :
- ['time']
- file_name :
- None
- format :
- None
- label :
- P3L Current
- mds_name :
- \TOP.ANALYSED.AMC:P3L_CURRENT
- name :
- amc/p3l_current
- quality :
- Not Checked
- rank :
- 1
- shape :
- [30000]
- shot_id :
- 30420
- signal_type :
- Analysed
- source :
- amc
- time_index :
- 0
- uda_name :
- AMC_P3L CURRENT
- units :
- kA * turn
- uuid :
- 9a9fb709-4ca7-5ccb-8697-bffe44d9583f
- version :
- 0
Array Chunk Bytes 117.19 kiB 117.19 kiB Shape (30000,) (30000,) Dask graph 1 chunks in 2 graph layers Data type float32 numpy.ndarray - p3l_feed_current(time)float32dask.array<chunksize=(30000,), meta=np.ndarray>
- description :
- dims :
- ['time']
- file_name :
- None
- format :
- None
- label :
- P3l Feed Current
- mds_name :
- \TOP.ANALYSED.AMC.P3L_FEED:CURRENT
- name :
- amc/p3l_feed_current
- quality :
- Not Checked
- rank :
- 1
- shape :
- [30000]
- shot_id :
- 30420
- signal_type :
- Analysed
- source :
- amc
- time_index :
- 0
- uda_name :
- AMC_P3L FEED CURRENT
- units :
- kA
- uuid :
- 2378bca5-a554-56b0-838e-b29f99803b2c
- version :
- 0
Array Chunk Bytes 117.19 kiB 117.19 kiB Shape (30000,) (30000,) Dask graph 1 chunks in 2 graph layers Data type float32 numpy.ndarray - p3u_case_current(time)float32dask.array<chunksize=(30000,), meta=np.ndarray>
- description :
- dims :
- ['time']
- file_name :
- None
- format :
- None
- label :
- P3U Case Current
- mds_name :
- \TOP.ANALYSED.AMC.P3U_CASE:CURRENT
- name :
- amc/p3u_case_current
- quality :
- Not Checked
- rank :
- 1
- shape :
- [30000]
- shot_id :
- 30420
- signal_type :
- Analysed
- source :
- amc
- time_index :
- 0
- uda_name :
- AMC_P3U CASE CURRENT
- units :
- kA
- uuid :
- ba240fad-6013-5da0-8e24-f416ed793b94
- version :
- 0
Array Chunk Bytes 117.19 kiB 117.19 kiB Shape (30000,) (30000,) Dask graph 1 chunks in 2 graph layers Data type float32 numpy.ndarray - p3u_coil_current(time)float32dask.array<chunksize=(30000,), meta=np.ndarray>
- description :
- dims :
- ['time']
- file_name :
- None
- format :
- None
- label :
- P3U Coil Current
- mds_name :
- \TOP.ANALYSED.AMC.P3U_COIL:CURRENT
- name :
- amc/p3u_coil_current
- quality :
- Not Checked
- rank :
- 1
- shape :
- [30000]
- shot_id :
- 30420
- signal_type :
- Analysed
- source :
- amc
- time_index :
- 0
- uda_name :
- AMC_P3U COIL CURRENT
- units :
- kA * turn
- uuid :
- 3b4af51c-ed63-5349-9eed-d913f4ba2afa
- version :
- 0
Array Chunk Bytes 117.19 kiB 117.19 kiB Shape (30000,) (30000,) Dask graph 1 chunks in 2 graph layers Data type float32 numpy.ndarray - p3u_current(time)float32dask.array<chunksize=(30000,), meta=np.ndarray>
- description :
- Internal P3U current
- dims :
- ['time']
- file_name :
- None
- format :
- None
- label :
- P3U Current
- mds_name :
- \TOP.ANALYSED.AMC:P3U_CURRENT
- name :
- amc/p3u_current
- quality :
- Not Checked
- rank :
- 1
- shape :
- [30000]
- shot_id :
- 30420
- signal_type :
- Analysed
- source :
- amc
- time_index :
- 0
- uda_name :
- AMC_P3U CURRENT
- units :
- kA * turn
- uuid :
- 4cf1388c-8f2e-5c30-93c6-d2b7d40da40b
- version :
- 0
Array Chunk Bytes 117.19 kiB 117.19 kiB Shape (30000,) (30000,) Dask graph 1 chunks in 2 graph layers Data type float32 numpy.ndarray - p3u_feed_current(time)float32dask.array<chunksize=(30000,), meta=np.ndarray>
- description :
- P3U winding current - measured at P3/4/5 link board
- dims :
- ['time']
- file_name :
- None
- format :
- None
- label :
- P3u Feed Current
- mds_name :
- \TOP.ANALYSED.AMC.P3U_FEED:CURRENT
- name :
- amc/p3u_feed_current
- quality :
- Not Checked
- rank :
- 1
- shape :
- [30000]
- shot_id :
- 30420
- signal_type :
- Analysed
- source :
- amc
- time_index :
- 0
- uda_name :
- AMC_P3U FEED CURRENT
- units :
- kA
- uuid :
- 88fe288b-25c1-59f8-949a-a54e2cb360d7
- version :
- 0
Array Chunk Bytes 117.19 kiB 117.19 kiB Shape (30000,) (30000,) Dask graph 1 chunks in 2 graph layers Data type float32 numpy.ndarray - p4l_case_current(time)float32dask.array<chunksize=(30000,), meta=np.ndarray>
- description :
- dims :
- ['time']
- file_name :
- None
- format :
- None
- label :
- P4L Case Current
- mds_name :
- \TOP.ANALYSED.AMC.P4L_CASE:CURRENT
- name :
- amc/p4l_case_current
- quality :
- Not Checked
- rank :
- 1
- shape :
- [30000]
- shot_id :
- 30420
- signal_type :
- Analysed
- source :
- amc
- time_index :
- 0
- uda_name :
- AMC_P4L CASE CURRENT
- units :
- kA
- uuid :
- a28f9810-827c-56d9-8622-7ca19671d44d
- version :
- 0
Array Chunk Bytes 117.19 kiB 117.19 kiB Shape (30000,) (30000,) Dask graph 1 chunks in 2 graph layers Data type float32 numpy.ndarray - p4l_coil_current(time)float32dask.array<chunksize=(30000,), meta=np.ndarray>
- description :
- dims :
- ['time']
- file_name :
- None
- format :
- None
- label :
- P4L Coil Current
- mds_name :
- \TOP.ANALYSED.AMC.P4L_COIL:CURRENT
- name :
- amc/p4l_coil_current
- quality :
- Not Checked
- rank :
- 1
- shape :
- [30000]
- shot_id :
- 30420
- signal_type :
- Analysed
- source :
- amc
- time_index :
- 0
- uda_name :
- AMC_P4L COIL CURRENT
- units :
- kA * turn
- uuid :
- 7ddc00ba-98cc-518e-93d9-50ba85196fc9
- version :
- 0
Array Chunk Bytes 117.19 kiB 117.19 kiB Shape (30000,) (30000,) Dask graph 1 chunks in 2 graph layers Data type float32 numpy.ndarray - p4l_current(time)float32dask.array<chunksize=(30000,), meta=np.ndarray>
- description :
- Internal P4L current
- dims :
- ['time']
- file_name :
- None
- format :
- None
- label :
- P4L Current
- mds_name :
- \TOP.ANALYSED.AMC:P4L_CURRENT
- name :
- amc/p4l_current
- quality :
- Not Checked
- rank :
- 1
- shape :
- [30000]
- shot_id :
- 30420
- signal_type :
- Analysed
- source :
- amc
- time_index :
- 0
- uda_name :
- AMC_P4L CURRENT
- units :
- kA * turn
- uuid :
- 12619bbb-9d72-5784-82d3-041b1a0678cc
- version :
- 0
Array Chunk Bytes 117.19 kiB 117.19 kiB Shape (30000,) (30000,) Dask graph 1 chunks in 2 graph layers Data type float32 numpy.ndarray - p4l_feed_current(time)float32dask.array<chunksize=(30000,), meta=np.ndarray>
- description :
- P4L winding current - measured at P3/4/5 link board
- dims :
- ['time']
- file_name :
- None
- format :
- None
- label :
- P4l Feed Current
- mds_name :
- \TOP.ANALYSED.AMC.P4L_FEED:CURRENT
- name :
- amc/p4l_feed_current
- quality :
- Not Checked
- rank :
- 1
- shape :
- [30000]
- shot_id :
- 30420
- signal_type :
- Analysed
- source :
- amc
- time_index :
- 0
- uda_name :
- AMC_P4L FEED CURRENT
- units :
- kA
- uuid :
- 8cd586d7-3ee9-5eb8-b00f-e1f4431d4f27
- version :
- 0
Array Chunk Bytes 117.19 kiB 117.19 kiB Shape (30000,) (30000,) Dask graph 1 chunks in 2 graph layers Data type float32 numpy.ndarray - p4u_case_current(time)float32dask.array<chunksize=(30000,), meta=np.ndarray>
- description :
- dims :
- ['time']
- file_name :
- None
- format :
- None
- label :
- P4U Case Current
- mds_name :
- \TOP.ANALYSED.AMC.P4U_CASE:CURRENT
- name :
- amc/p4u_case_current
- quality :
- Not Checked
- rank :
- 1
- shape :
- [30000]
- shot_id :
- 30420
- signal_type :
- Analysed
- source :
- amc
- time_index :
- 0
- uda_name :
- AMC_P4U CASE CURRENT
- units :
- kA
- uuid :
- bab05664-c0cf-5bbd-a0ee-2bcc19899f4a
- version :
- 0
Array Chunk Bytes 117.19 kiB 117.19 kiB Shape (30000,) (30000,) Dask graph 1 chunks in 2 graph layers Data type float32 numpy.ndarray - p4u_coil_current(time)float32dask.array<chunksize=(30000,), meta=np.ndarray>
- description :
- dims :
- ['time']
- file_name :
- None
- format :
- None
- label :
- P4U Coil Current
- mds_name :
- \TOP.ANALYSED.AMC.P4U_COIL:CURRENT
- name :
- amc/p4u_coil_current
- quality :
- Not Checked
- rank :
- 1
- shape :
- [30000]
- shot_id :
- 30420
- signal_type :
- Analysed
- source :
- amc
- time_index :
- 0
- uda_name :
- AMC_P4U COIL CURRENT
- units :
- kA * turn
- uuid :
- 83df05ea-5dd2-5d55-af2c-f6f62880f5b9
- version :
- 0
Array Chunk Bytes 117.19 kiB 117.19 kiB Shape (30000,) (30000,) Dask graph 1 chunks in 2 graph layers Data type float32 numpy.ndarray - p4u_current(time)float32dask.array<chunksize=(30000,), meta=np.ndarray>
- description :
- Internal P4U current
- dims :
- ['time']
- file_name :
- None
- format :
- None
- label :
- P4U Current
- mds_name :
- \TOP.ANALYSED.AMC:P4U_CURRENT
- name :
- amc/p4u_current
- quality :
- Not Checked
- rank :
- 1
- shape :
- [30000]
- shot_id :
- 30420
- signal_type :
- Analysed
- source :
- amc
- time_index :
- 0
- uda_name :
- AMC_P4U CURRENT
- units :
- kA * turn
- uuid :
- c8019ebe-400c-5846-8233-80b1d08a9e03
- version :
- 0
Array Chunk Bytes 117.19 kiB 117.19 kiB Shape (30000,) (30000,) Dask graph 1 chunks in 2 graph layers Data type float32 numpy.ndarray - p4u_feed_current(time)float32dask.array<chunksize=(30000,), meta=np.ndarray>
- description :
- P4U winding current - measured at P3/4/5 link board
- dims :
- ['time']
- file_name :
- None
- format :
- None
- label :
- P4u Feed Current
- mds_name :
- \TOP.ANALYSED.AMC.P4U_FEED:CURRENT
- name :
- amc/p4u_feed_current
- quality :
- Not Checked
- rank :
- 1
- shape :
- [30000]
- shot_id :
- 30420
- signal_type :
- Analysed
- source :
- amc
- time_index :
- 0
- uda_name :
- AMC_P4U FEED CURRENT
- units :
- kA
- uuid :
- fbfe5693-2fa1-577b-8567-76261174b0c4
- version :
- 0
Array Chunk Bytes 117.19 kiB 117.19 kiB Shape (30000,) (30000,) Dask graph 1 chunks in 2 graph layers Data type float32 numpy.ndarray - p5l_case_current(time)float32dask.array<chunksize=(30000,), meta=np.ndarray>
- description :
- dims :
- ['time']
- file_name :
- None
- format :
- None
- label :
- P5L Case Current
- mds_name :
- \TOP.ANALYSED.AMC.P5L_CASE:CURRENT
- name :
- amc/p5l_case_current
- quality :
- Not Checked
- rank :
- 1
- shape :
- [30000]
- shot_id :
- 30420
- signal_type :
- Analysed
- source :
- amc
- time_index :
- 0
- uda_name :
- AMC_P5L CASE CURRENT
- units :
- kA
- uuid :
- 94e8a842-4c13-56c3-b581-1279db9762a0
- version :
- 0
Array Chunk Bytes 117.19 kiB 117.19 kiB Shape (30000,) (30000,) Dask graph 1 chunks in 2 graph layers Data type float32 numpy.ndarray - p5l_coil_current(time)float32dask.array<chunksize=(30000,), meta=np.ndarray>
- description :
- dims :
- ['time']
- file_name :
- None
- format :
- None
- label :
- P5L Coil Current
- mds_name :
- \TOP.ANALYSED.AMC.P5L_COIL:CURRENT
- name :
- amc/p5l_coil_current
- quality :
- Not Checked
- rank :
- 1
- shape :
- [30000]
- shot_id :
- 30420
- signal_type :
- Analysed
- source :
- amc
- time_index :
- 0
- uda_name :
- AMC_P5L COIL CURRENT
- units :
- kA * turn
- uuid :
- 1f786b53-7971-54ae-a013-f07405e398ca
- version :
- 0
Array Chunk Bytes 117.19 kiB 117.19 kiB Shape (30000,) (30000,) Dask graph 1 chunks in 2 graph layers Data type float32 numpy.ndarray - p5l_current(time)float32dask.array<chunksize=(30000,), meta=np.ndarray>
- description :
- Internal P5L current
- dims :
- ['time']
- file_name :
- None
- format :
- None
- label :
- P5L Current
- mds_name :
- \TOP.ANALYSED.AMC:P5L_CURRENT
- name :
- amc/p5l_current
- quality :
- Not Checked
- rank :
- 1
- shape :
- [30000]
- shot_id :
- 30420
- signal_type :
- Analysed
- source :
- amc
- time_index :
- 0
- uda_name :
- AMC_P5L CURRENT
- units :
- kA * turn
- uuid :
- 7f0ab6cd-61cd-502e-af7e-646dc4e7cf12
- version :
- 0
Array Chunk Bytes 117.19 kiB 117.19 kiB Shape (30000,) (30000,) Dask graph 1 chunks in 2 graph layers Data type float32 numpy.ndarray - p5l_feed_current(time)float32dask.array<chunksize=(30000,), meta=np.ndarray>
- description :
- P5L winding current - measured at P3/4/5 link board
- dims :
- ['time']
- file_name :
- None
- format :
- None
- label :
- P5l Feed Current
- mds_name :
- \TOP.ANALYSED.AMC.P5L_FEED:CURRENT
- name :
- amc/p5l_feed_current
- quality :
- Not Checked
- rank :
- 1
- shape :
- [30000]
- shot_id :
- 30420
- signal_type :
- Analysed
- source :
- amc
- time_index :
- 0
- uda_name :
- AMC_P5L FEED CURRENT
- units :
- kA
- uuid :
- 0d4b200c-35e6-52d0-b759-297842b2dcd3
- version :
- 0
Array Chunk Bytes 117.19 kiB 117.19 kiB Shape (30000,) (30000,) Dask graph 1 chunks in 2 graph layers Data type float32 numpy.ndarray - p5u_case_current(time)float32dask.array<chunksize=(30000,), meta=np.ndarray>
- description :
- dims :
- ['time']
- file_name :
- None
- format :
- None
- label :
- P5U Case Current
- mds_name :
- \TOP.ANALYSED.AMC.P5U_CASE:CURRENT
- name :
- amc/p5u_case_current
- quality :
- Not Checked
- rank :
- 1
- shape :
- [30000]
- shot_id :
- 30420
- signal_type :
- Analysed
- source :
- amc
- time_index :
- 0
- uda_name :
- AMC_P5U CASE CURRENT
- units :
- kA
- uuid :
- 2b648bdd-e3a8-53b7-9b10-47cd1208bd4a
- version :
- 0
Array Chunk Bytes 117.19 kiB 117.19 kiB Shape (30000,) (30000,) Dask graph 1 chunks in 2 graph layers Data type float32 numpy.ndarray - p5u_coil_current(time)float32dask.array<chunksize=(30000,), meta=np.ndarray>
- description :
- dims :
- ['time']
- file_name :
- None
- format :
- None
- label :
- P5U Coil Current
- mds_name :
- \TOP.ANALYSED.AMC.P5U_COIL:CURRENT
- name :
- amc/p5u_coil_current
- quality :
- Not Checked
- rank :
- 1
- shape :
- [30000]
- shot_id :
- 30420
- signal_type :
- Analysed
- source :
- amc
- time_index :
- 0
- uda_name :
- AMC_P5U COIL CURRENT
- units :
- kA * turn
- uuid :
- 346777d8-9808-5b84-883a-5ed522a96f42
- version :
- 0
Array Chunk Bytes 117.19 kiB 117.19 kiB Shape (30000,) (30000,) Dask graph 1 chunks in 2 graph layers Data type float32 numpy.ndarray - p5u_current(time)float32dask.array<chunksize=(30000,), meta=np.ndarray>
- description :
- Internal P5U current
- dims :
- ['time']
- file_name :
- None
- format :
- None
- label :
- P5U Current
- mds_name :
- \TOP.ANALYSED.AMC:P5U_CURRENT
- name :
- amc/p5u_current
- quality :
- Not Checked
- rank :
- 1
- shape :
- [30000]
- shot_id :
- 30420
- signal_type :
- Analysed
- source :
- amc
- time_index :
- 0
- uda_name :
- AMC_P5U CURRENT
- units :
- kA * turn
- uuid :
- ffb66909-326a-5dd9-915c-3257b0afe32f
- version :
- 0
Array Chunk Bytes 117.19 kiB 117.19 kiB Shape (30000,) (30000,) Dask graph 1 chunks in 2 graph layers Data type float32 numpy.ndarray - p5u_feed_current(time)float32dask.array<chunksize=(30000,), meta=np.ndarray>
- description :
- P5U winding current - measured at P3/4/5 link board
- dims :
- ['time']
- file_name :
- None
- format :
- None
- label :
- P5u Feed Current
- mds_name :
- \TOP.ANALYSED.AMC.P5U_FEED:CURRENT
- name :
- amc/p5u_feed_current
- quality :
- Not Checked
- rank :
- 1
- shape :
- [30000]
- shot_id :
- 30420
- signal_type :
- Analysed
- source :
- amc
- time_index :
- 0
- uda_name :
- AMC_P5U FEED CURRENT
- units :
- kA
- uuid :
- 919e1597-f986-5556-b427-df2dc2d6d075
- version :
- 0
Array Chunk Bytes 117.19 kiB 117.19 kiB Shape (30000,) (30000,) Dask graph 1 chunks in 2 graph layers Data type float32 numpy.ndarray - p6l_current(time)float32dask.array<chunksize=(30000,), meta=np.ndarray>
- description :
- Internal P6L current
- dims :
- ['time']
- file_name :
- None
- format :
- None
- label :
- P6L Current
- mds_name :
- \TOP.ANALYSED.AMC:P6L_CURRENT
- name :
- amc/p6l_current
- quality :
- Not Checked
- rank :
- 1
- shape :
- [30000]
- shot_id :
- 30420
- signal_type :
- Analysed
- source :
- amc
- time_index :
- 0
- uda_name :
- AMC_P6L CURRENT
- units :
- kA * turn
- uuid :
- f2032ccb-441e-5241-9a9e-ba1d37c5f437
- version :
- 0
Array Chunk Bytes 117.19 kiB 117.19 kiB Shape (30000,) (30000,) Dask graph 1 chunks in 2 graph layers Data type float32 numpy.ndarray - p6u_current(time)float32dask.array<chunksize=(30000,), meta=np.ndarray>
- description :
- Internal P6U current
- dims :
- ['time']
- file_name :
- None
- format :
- None
- label :
- P6U Current
- mds_name :
- \TOP.ANALYSED.AMC:P6U_CURRENT
- name :
- amc/p6u_current
- quality :
- Not Checked
- rank :
- 1
- shape :
- [30000]
- shot_id :
- 30420
- signal_type :
- Analysed
- source :
- amc
- time_index :
- 0
- uda_name :
- AMC_P6U CURRENT
- units :
- kA * turn
- uuid :
- e48ade2b-11e4-5793-9ad0-0a754c0aa488
- version :
- 0
Array Chunk Bytes 117.19 kiB 117.19 kiB Shape (30000,) (30000,) Dask graph 1 chunks in 2 graph layers Data type float32 numpy.ndarray - plasma_current(time)float32dask.array<chunksize=(30000,), meta=np.ndarray>
- description :
- Plasma Current
- dims :
- ['time']
- file_name :
- None
- format :
- None
- label :
- Plasma Current
- mds_name :
- \TOP.ANALYSED.AMC.PLASMA:CURRENT
- name :
- amc/plasma_current
- quality :
- Not Checked
- rank :
- 1
- shape :
- [30000]
- shot_id :
- 30420
- signal_type :
- Analysed
- source :
- amc
- time_index :
- 0
- uda_name :
- AMC_PLASMA CURRENT
- units :
- kA
- uuid :
- 6327e756-e587-5c74-8aed-4e595d3546cf
- version :
- 0
Array Chunk Bytes 117.19 kiB 117.19 kiB Shape (30000,) (30000,) Dask graph 1 chunks in 2 graph layers Data type float32 numpy.ndarray - sol_current(time)float32dask.array<chunksize=(30000,), meta=np.ndarray>
- description :
- P1PS - Solenoid Feed Current
- dims :
- ['time']
- file_name :
- None
- format :
- None
- label :
- Sol Current
- mds_name :
- \TOP.ANALYSED.AMC:SOL_CURRENT
- name :
- amc/sol_current
- quality :
- Not Checked
- rank :
- 1
- shape :
- [30000]
- shot_id :
- 30420
- signal_type :
- Analysed
- source :
- amc
- time_index :
- 0
- uda_name :
- AMC_SOL CURRENT
- units :
- kA
- uuid :
- b2b6c10b-15cf-5a15-82e8-2a53e5be144d
- version :
- 0
Array Chunk Bytes 117.19 kiB 117.19 kiB Shape (30000,) (30000,) Dask graph 1 chunks in 2 graph layers Data type float32 numpy.ndarray - status()float32...
- description :
- dims :
- []
- file_name :
- None
- format :
- None
- label :
- mds_name :
- \TOP.ANALYSED.AMC:STATUS
- name :
- amc/status
- quality :
- Not Checked
- rank :
- 1
- shape :
- [1]
- shot_id :
- 30420
- signal_type :
- Analysed
- source :
- amc
- time_index :
- 0
- uda_name :
- AMC_STATUS
- units :
- uuid :
- 19528798-cd4d-5799-90e5-528d5b275b0c
- version :
- 0
[1 values with dtype=float32]
- tf_current(time)float32dask.array<chunksize=(30000,), meta=np.ndarray>
- description :
- TF feed current measured in north duct
- dims :
- ['time']
- file_name :
- None
- format :
- None
- label :
- TF Current
- mds_name :
- \TOP.ANALYSED.AMC:TF_CURRENT
- name :
- amc/tf_current
- quality :
- Not Checked
- rank :
- 1
- shape :
- [30000]
- shot_id :
- 30420
- signal_type :
- Analysed
- source :
- amc
- time_index :
- 0
- uda_name :
- AMC_TF CURRENT
- units :
- kA
- uuid :
- 50cd98f3-8f4d-543d-be7a-bf06e87c477e
- version :
- 0
Array Chunk Bytes 117.19 kiB 117.19 kiB Shape (30000,) (30000,) Dask graph 1 chunks in 2 graph layers Data type float32 numpy.ndarray - version()float32...
- description :
- dims :
- []
- file_name :
- None
- format :
- None
- label :
- mds_name :
- \TOP.ANALYSED.AMC:VERSION
- name :
- amc/version
- quality :
- Not Checked
- rank :
- 1
- shape :
- [1]
- shot_id :
- 30420
- signal_type :
- Analysed
- source :
- amc
- time_index :
- 0
- uda_name :
- AMC_VERSION
- units :
- uuid :
- 723bd0c7-5695-5576-8f7f-2203f6797ee4
- version :
- 0
[1 values with dtype=float32]
- timePandasIndex
PandasIndex(Index([ -2.000000238418579,  -1.999800205230713, -1.9996002912521362,
         -1.99940025806427, -1.9992002248764038, -1.9990001916885376,
        -1.998800277709961, -1.9986002445220947, -1.9984002113342285,
       -1.9982002973556519,
       ...
         3.997999429702759,   3.998199701309204,   3.998399496078491,
        3.9985997676849365,  3.9987995624542236,   3.998999834060669,
         3.999199628829956,   3.999399423599243,  3.9995996952056885,
        3.9997994899749756],
      dtype='float32', name='time', length=30000))
- description :
- Plasma Current and PF/TF Coil Currents
- file_name :
- amc0304.20
- format :
- IDA3
- mds_name :
- None
- name :
- amc
- quality :
- Not Checked
- shot_id :
- 30420
- signal_type :
- Analysed
- source :
- amc
- uda_name :
- AMC
- uuid :
- 01aad0c4-2a84-59e2-8b1b-168b4bd66aa3
- version :
- 0
# Sam's function
# Function to detect change points using a basic moving average method
def detect_change_points(time, intensity, window_size=50, threshold=2.0):
"""
Detects change points based on the difference in moving average intensity.
Args:
- time (np.array): Time array.
- intensity (np.array): Intensity array.
- window_size (int): Size of the window for calculating moving average.
- threshold (float): Threshold for detecting significant changes.
Returns:
- change_points (list): List of times when significant changes are detected.
"""
moving_avg = np.convolve(intensity, np.ones(window_size) / window_size, mode='valid')
diff = np.abs(np.diff(moving_avg))
change_indices = np.where(diff > threshold)[0] + window_size # Adjust index for valid region
change_points = time[change_indices]
return change_points
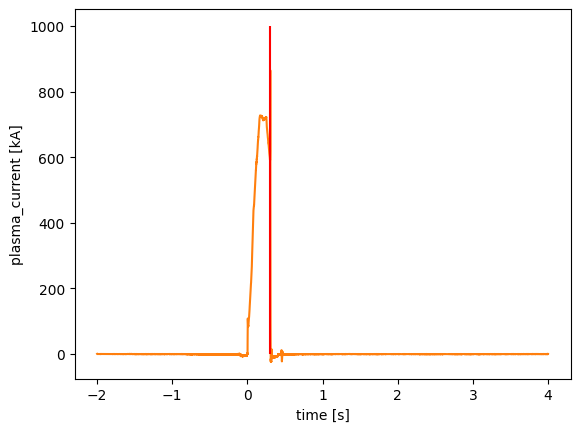
cp = detect_change_points(amc['plasma_current'].time, amc['plasma_current'], window_size=3, threshold=20)
cp
<xarray.DataArray 'time' (time: 26)> Size: 104B
array([0.3036, 0.3038, 0.304 , 0.3042, 0.3044, 0.3046, 0.305 , 0.3052, 0.3054,
       0.3056, 0.3058, 0.306 , 0.3062, 0.3064, 0.3066, 0.3068, 0.307 , 0.3072,
       0.3074, 0.3076, 0.3078, 0.308 , 0.3082, 0.3084, 0.3086, 0.3088],
      dtype=float32)
Coordinates:
  * time     (time) float32 104B 0.3036 0.3038 0.304 ... 0.3084 0.3086 0.3088
Attributes:
    units:    s
xarray.DataArray
'time'
- time: 26
- 0.3036 0.3038 0.304 0.3042 0.3044 ... 0.3082 0.3084 0.3086 0.3088
array([0.3036, 0.3038, 0.304 , 0.3042, 0.3044, 0.3046, 0.305 , 0.3052, 0.3054, 0.3056, 0.3058, 0.306 , 0.3062, 0.3064, 0.3066, 0.3068, 0.307 , 0.3072, 0.3074, 0.3076, 0.3078, 0.308 , 0.3082, 0.3084, 0.3086, 0.3088], dtype=float32) - time(time)float320.3036 0.3038 ... 0.3086 0.3088
- units :
- s
array([0.3036, 0.3038, 0.304 , 0.3042, 0.3044, 0.3046, 0.305 , 0.3052, 0.3054,
       0.3056, 0.3058, 0.306 , 0.3062, 0.3064, 0.3066, 0.3068, 0.307 , 0.3072,
       0.3074, 0.3076, 0.3078, 0.308 , 0.3082, 0.3084, 0.3086, 0.3088],
      dtype=float32)
- timePandasIndex
PandasIndex(Index([0.30359959602355957,  0.3037996292114258,   0.303999662399292,
        0.3041996955871582,  0.3043997287750244,  0.3045997619628906,
       0.30499958992004395, 0.30519962310791016, 0.30539965629577637,
        0.3055996894836426,  0.3057997226715088,   0.305999755859375,
        0.3061997890472412,  0.3063998222351074, 0.30659961700439453,
       0.30679965019226074, 0.30699968338012695, 0.30719971656799316,
        0.3073997497558594,  0.3075997829437256,  0.3077998161315918,
        0.3079996109008789,  0.3081996440887451, 0.30839967727661133,
       0.30859971046447754, 0.30879974365234375],
      dtype='float32', name='time'))
- units :
- s
# plot using xarray
plt.plot(1)
amc['plasma_current'].plot()

plt.vlines(cp[0], 0, 1000, color='r')
<matplotlib.collections.LineCollection at 0x74bdf667c100>