Training and optional results
Click Validate before Train PINN (F5). Validation checks the supported problem graph and settings. It does not establish that the trained solution will reach a particular accuracy.
Fix problems before training
Click Validate (or Run → Validate model, Ctrl+D) to open the Model validation report. It collects independent missing connections, invalid network/physics settings, boundary expressions, method compatibility and input file issues instead of showing only the first failure.
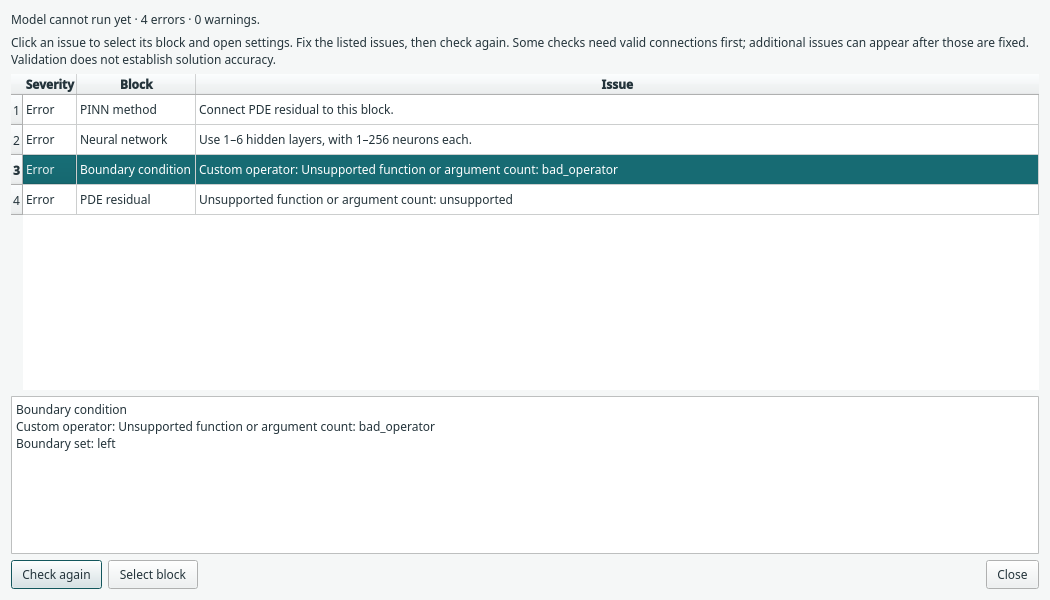
An actual graph with a missing PDE connection, invalid hidden layers and two invalid physics expressions. No training, prediction or automatic repair was performed while producing this report.
Click an issue to select and centre its block and open the inspector. Boundary issues select their named set where applicable; coupled-flow issues identify the component and its target/operator. Select block provides the same action. Project-wide issues may involve several components and have no single owner. A removed block is reported safely rather than selected through a stale reference.
Fix the settings/connections, then click Check again. A model-change notice marks older results as stale. Some cross-component checks need valid connections first, so further issues may appear after those are fixed. The report deliberately does not claim to enumerate every possible issue in an incomplete graph.
Errors prevent execution. Warnings identify additional declarations such as unconnected optional output/data blocks, which the executor does not use. The supported numerical execution checks remain required for Train and Evaluate; no new trainer combinations are inferred from a passing report. Active data issues also block execution early: missing or mismatched imported references and prepared-domain plots without Evaluation points no longer wait until prediction to fail. Successful validation does not establish numerical accuracy or guarantee that checkpoint data identity still matches on resume.
The report does not change graph settings, files or undo history, clear existing results, train a model, evaluate a network or open a numerical output pane. Project data overview provides the separate file inventory and session change warnings. Programmatic desktop checks still return a boolean and do not open the report automatically; the explicit Validate action opens it.
During training, progress and operational messages remain available. Stop requests are checked between batches of 25 updates. A stopped partial run can retain results and a checkpoint; changing the numerical model then invalidates them.
Ask for the views you need
| Block | What it requests | How to open |
|---|---|---|
| Training Monitor | Recorded loss history | Double-click or Open monitor |
| Solution Plot | Predicted field values on an evaluation grid | Double-click or Open plot |
| Comparison | Predictions and an explicitly supplied reference | Connect both inputs, then Open comparison |
| CSV Export / ParaView Export | Evaluation data for an external file | Explicit export action after training |
The startup graph has no outputs. Complete examples wire useful optional outputs, but their windows remain closed until opened. You can keep training without a figure on screen. Closing a view is different from deleting its block.
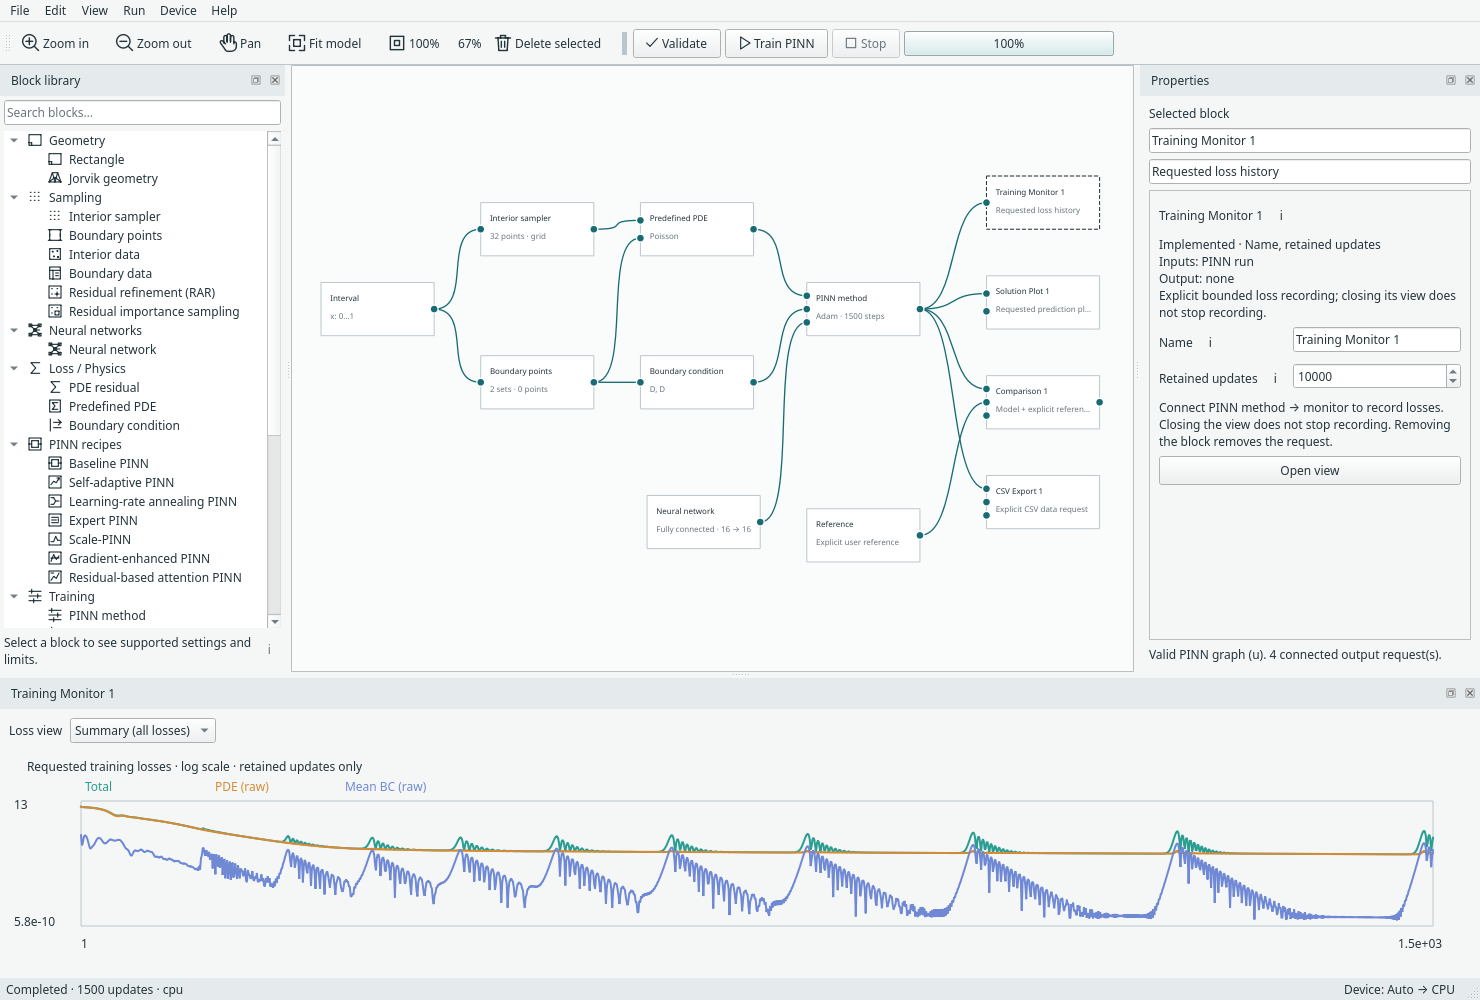
The block-owned monitor appears as a dockable results tab. Open full size.
Read the losses in context
The monitor's Loss view selector keeps the existing summary and lets you select any named boundary, initial, periodic or gauge constraint. The selected view shows Raw loss and Weighted contribution to the actual objective, including the overall coefficient, per-constraint coefficient and any adaptive trainer weighting. Values are measured before each update, including before SA mask updates. Older records without weighted diagnostics show a labelled gap; the monitor does not reconstruct them from today's settings.
Per-term PDE/constraint curves describe physical errors at training locations. The total includes the configured method's weights; SA and LRA change their objectives during training. A smaller total across two different methods need not mean a better field solution. A reference is not required to see losses.
Predictions and comparisons
Prediction resolution controls an independent regular evaluation grid. It does
not change the training samples. For scalar examples the existing plot views are
available. Coupled u,v,p results use tables and multi-column exports. A preview
table can show only the first rows while export includes the requested grid.
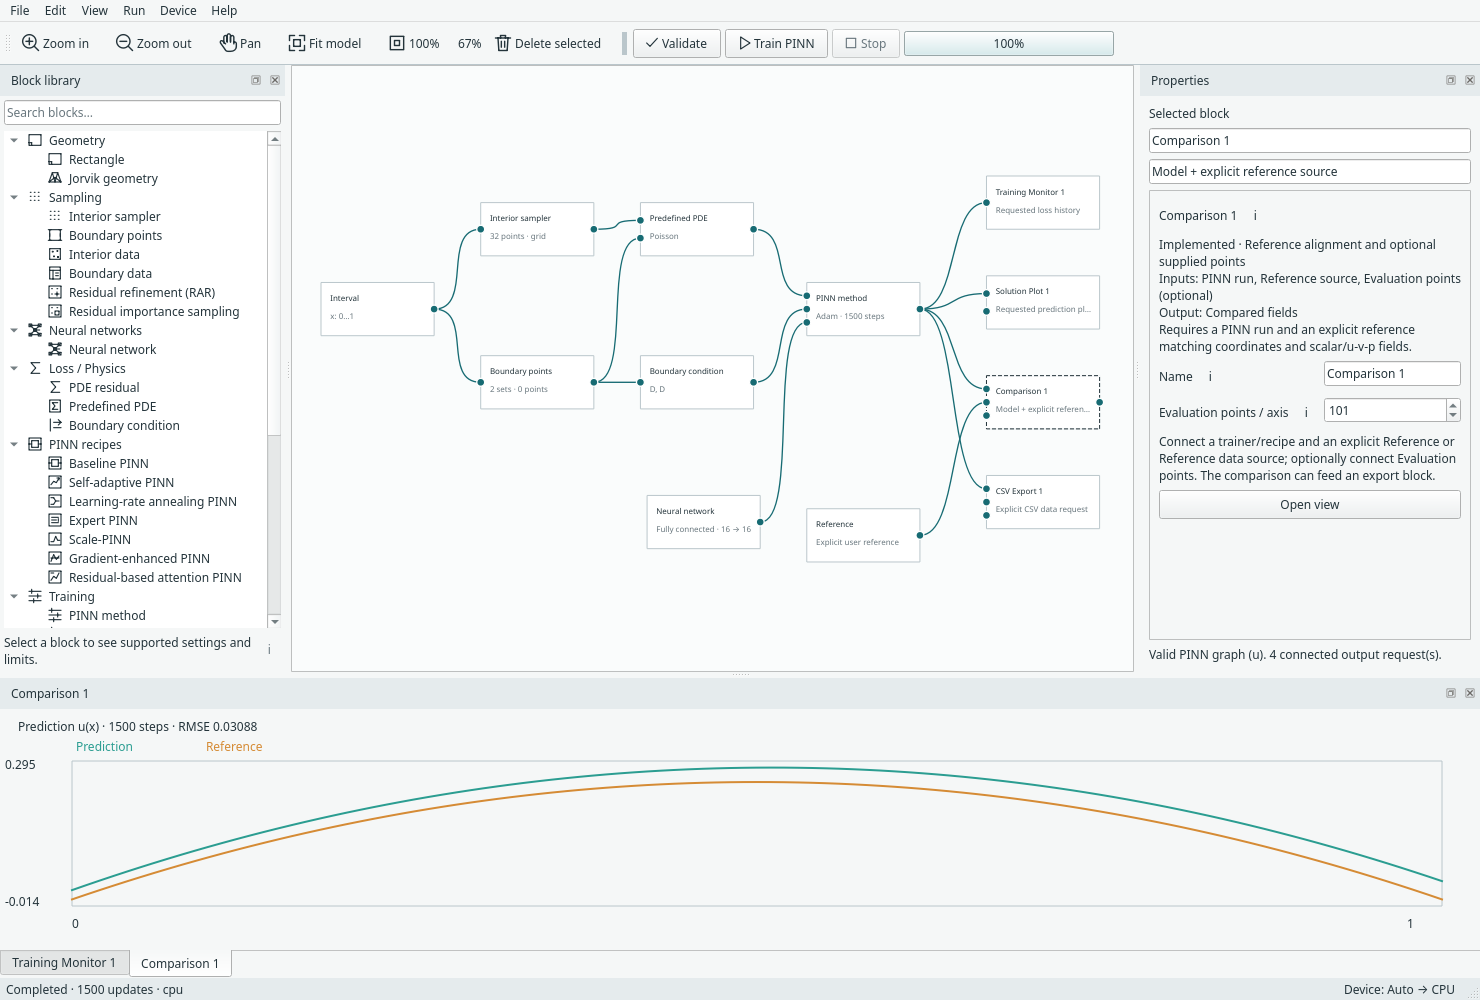
An explicit scalar comparison tab; the reference is a separate graph input. Open full size.
References can be supported presets, restricted expressions or mapped data, under the documented contracts. An imported reference must match evaluation coordinates; it is not silently interpolated from an arbitrary FEM mesh. The heat rectangle reference is a labelled truncated series, not a universal exact solution.
Next: Save or resume, or export predictions.
Choose the application device
Use Device → Automatic, CPU or GPU once for the application. Automatic uses CUDA when available and otherwise the CPU. The menu identifies the available GPU and disables that choice when CUDA is unavailable. The status bar shows the effective target. This preference is remembered locally and overrides older per-block/model device values when a model is opened or an example is loaded.
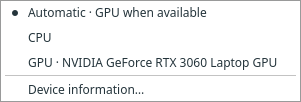
Training, checkpoint continuation and inference all use the selection. Changing it preserves trained weights; the next output evaluation reconstructs prediction weights on the selected target without optimizer updates. It does not recompute already displayed results automatically. Device changes are disabled while a job or external geometry editor is running. Data preparation, geometry, tables and file export continue on the CPU. The current GPU option uses the first CUDA device; additional accelerator backends and per-GPU indexing are not implemented.
Command-line scripts retain their explicit --device/configuration options; this
menu is a desktop preference. Model/run archives continue to record numerical
configuration and the actual device used for recorded outputs.
Read fuller setting descriptions
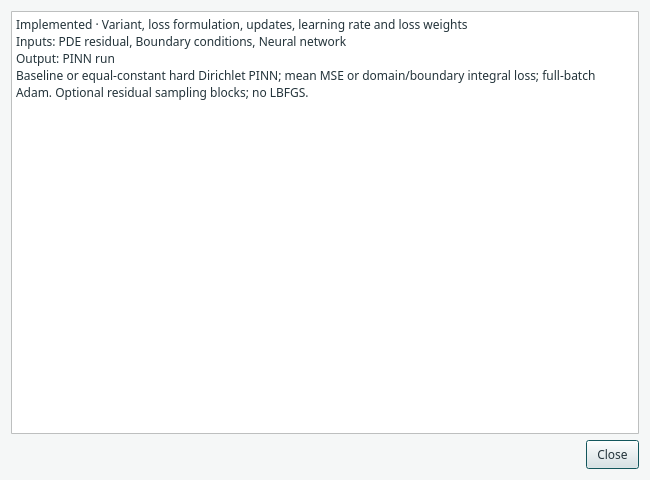
Click i beside an inspector setting or checkbox for an expanded description, its current value, available dropdown choices or numeric limits, and the block’s supported scope. The popup is scrollable and can stay open while you inspect other settings. Common numerical, network and advanced trainer options have additional explanations. Controls without a dedicated explanation show their current choices or limits with the block context.
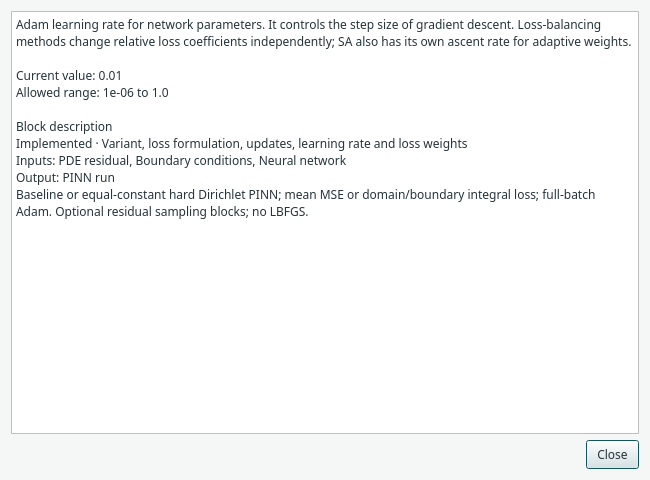
Use the block-header i, the block library’s i, or right-click Help to read the full block description without fitting it into the narrow properties pane.